Distortion processing
If Distortion processing within the processing of a measurement is activated, a simultaneous evaluation of harmonic distortion components is performed for measurements using logarithmic sweeps for excitation. If no suitable excitation is being used, a message informs that Distortion processing has been deactivated and the processing is not carried out.
The evaluation of distortion components is performed by separation of the harmonic distortion components compacted to “impulse responses”. As an example a near-field measurement of a tweeter is examined in the following. For excitation a logarithmic sweep with 2^17 samples and no bandwidth limiting has been used (SWP17DIS.MDA).
The following plot shows the IFFT of the complex frequency response in logarithmic amplitude scaling:
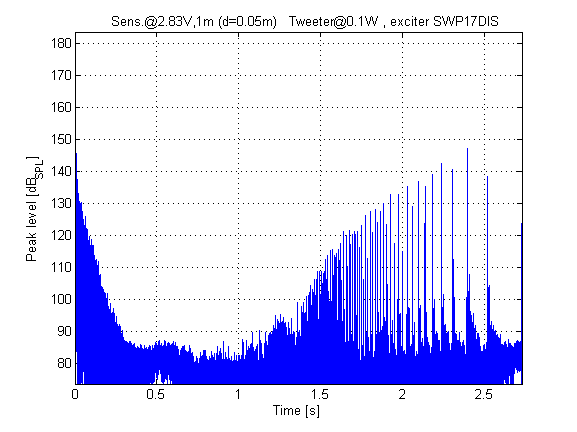
The actual impulse is located at approx. 0ms and reaches just under 185dB. The section starting at around 1.2s shows a series of peaks, which correspond to the respective distortion components. The distortion order increases from right to left (at 2.5s the impulse response of the 2. harmonic = H2IR is located). Another important detail is the distance of the HIRs: with increasing order the distance decreases. For further processing this means that a suitably short window needs to be found, in order to separate the individual HIRs. The window length after all defines the frequency resolution of the HIR spectra, so the following correlations are to be stated:
- the higher the distortion order to be evaluated is set, the smaller is the distance of the highest extracted HIR to its neighbour, thus determining the window length. So the frequency resolution decreases if the highest distortion order to be evaluated is raised.
- the longer the excitation signal, the larger the distance between HIRs, leading to higher frequency resolution
- as the window length increases with the length of the excitation signal (and hereby the power in the noise floor), averaging is required to increase the SNR
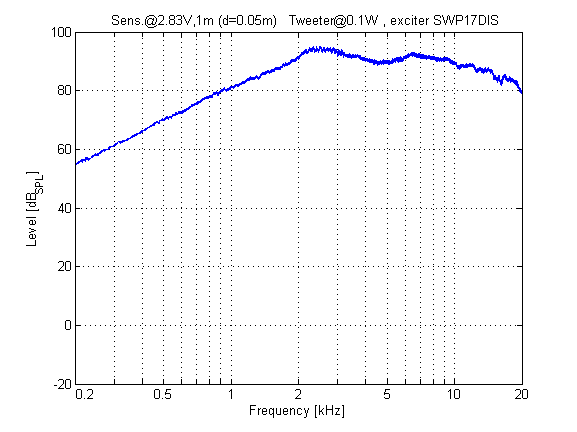
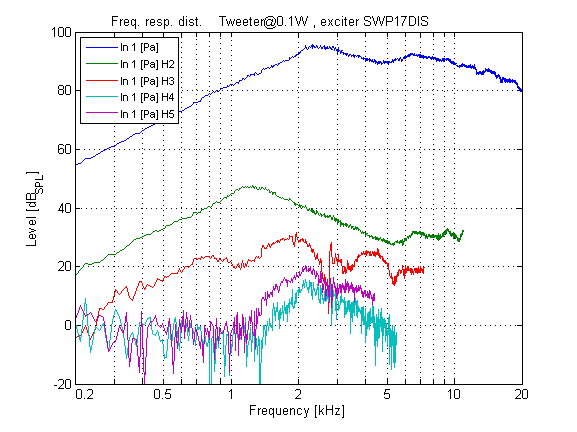
By automatic evaluation the absolute distortion can be displayed, so frequency response and distortion can be measured simultaneously:
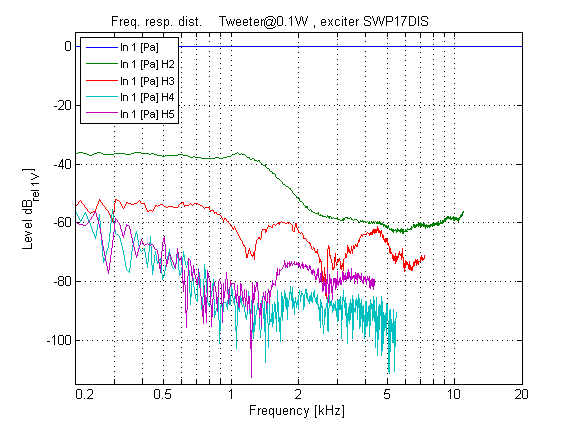
And in relative representation:
Compared to measurements using sine bursts, with the same frequency resolution the procedure described requires significantly shorter measuring times. However, this leads to considerably lower SNRs, which appear in the form of noisy responses for low distortion components. For better SNRs averaging would have to be applied, reducing the gain of the quicker measuring procedure. Furthermore, when comparing the measuring procedures, the effect of sweep measurements is to be taken into account, that their shorter measuring times can actually cause somewhat different distortion curves. Mainly this applies to tweeters filled with ferrofluid, whose distortion characteristics strongly react to temperature and thus depend on the energy input and therefore on the chronological background.