Display
In the Display section the settings for data plotting are made.
The display consists of the pull-down menu, the plotting area and the display settings.
The plotting area contains two cursors to be controlled by mouse or keyboard shortcuts.
Right underneath the plotting area the controls for axes scaling are to be found.
![]()
The level meter is located on the right, showing the level of the AD converters during and after a measurement. During the measurement the current level is shown, afterwards the maximum value is displayed. Weak levelling is shown in blue, good values (-20dBFS up to -3dBFS) in green, high levels (-3dBFS up to 0dBFS) are indicated in yellow and overload (more than 0dBFS) in red.
![]()
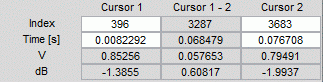
In the fields underneath cursor values can be read out.
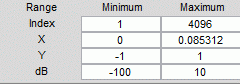
The value ranges to be plotted are defined by the range section.
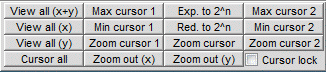
Cursor tools are located bottom left.
File infos are to be found bottom right.
![]()