Cursor tools
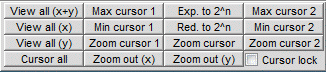
Cursor tools is a collection of buttons offering the functions described in the following:
| Function | Description |
|---|---|
View all (x+y) | The displayed ranges of x- and y-axis are adjusted, so that all data points of the curve are visible in the diagram. |
View all (x) | The displayed range only of the x-axis is adjusted, so that the entire index range is visible. |
View all (y) | The displayed range of the y-axis is adjusted, so that the entire value range of the curve is visible in the diagram. |
Max cursor 1 (2) | This function sets Cursor 1 (2) to the point with the maximum y-value within the range currently displayed. All values outside the range shown in the diagram are ignored by the procedure. |
Min cursor 1 (2) | This function sets Cursor 1 (2) to the point with the minimum y-value within the range currently displayed. |
Zoom cursor 1 (2) | The range around Cursor 1 (2) is zoomed in, centering Cursor 1 (2) in the diagram. |
Zoom out (x) | The displayed range around the active cursor is zoomed out, centering the cursor as far as possible. |
Exp. to 2^n | The active cursor is shifted in such a way, that the distance between the cursors (Index values) reaches the next power of 2. The field Cursor 1-2 / Index now shows the value 2^n-1. |
Red. to 2^n | The active cursor is shifted in such a way, that the distance between the cursors (Index values) is reduced to the next power of 2. The field Cursor 1-2 / Index now shows the value 2^n-1. |
Zoom Cursor | The diagram shows the range between the cursors. |
Zoom out (y) | The display range of the y-axis is increased. |
Cursor all | The entire range of the x-axis is displayed and the cursors are set to its limits, so the left cursor is located on the first sample, the right cursor on the last sample. |
Cursor lock | The distance between the cursors is locked. As long as this option is active, the cursors can only be moved in parallel. |