Plot
Here the content of the plotting areas can be written into graphic files.
Resolution is defined for the graphic file.
Format allows a choice of graphic data types.
Axes font and Legend font are defined for the respective labelling.
write grafic: a graphic file is created
write matlab fig.: a file in Matlab format is created
OK starts plotting, Cancel aborts the operation. The plot is saved under the current path and file name with the file extension of the respective graphic format.
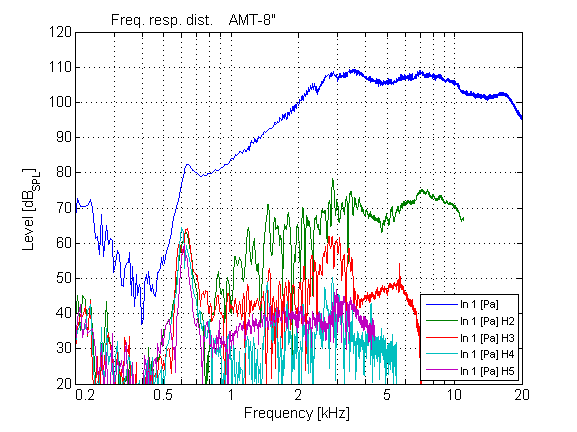
The following picture shows the plot of a sweep distortion measurement with the legend switched on (Position South east):