Display range
Here the section to be plotted is defined.
For the x-axis the range is set as described in Set region.
In the frequency domain additionally the y-axis range can be defined by entering upper (Display max. [dB]) and lower limit (Display min. [dB]).
In the time domain the y-axis range is set by entering the Display max. and Display min. values.
Short-cut: v sets the x-range to the values defined in the display range menu and closes the window.
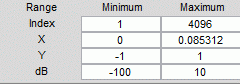
These display settings can also be modified directly in the range section underneath the plotting area.